
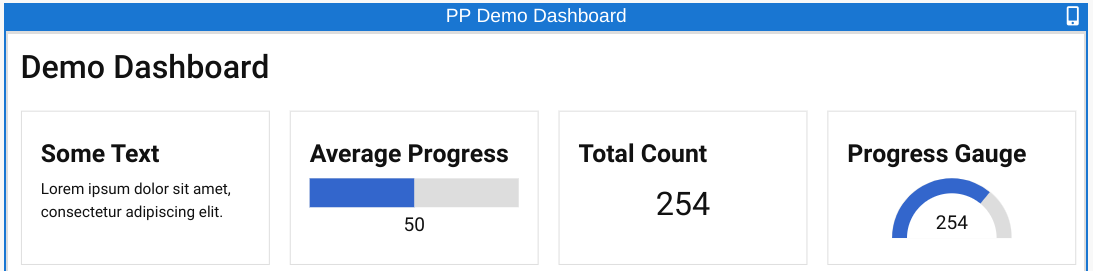
Dashboard
Dashboard screens allow you to show graphical charts and graphs from various data sources.
Code Events
- Before Process
- Before Render
- On Render
Please refer to 📜Code Events for more details.
Options
Dashboard widgets each have 2 options fields which accept JSON data.
- Card Options: applied to the card that the widget is in
- Widget Options: applied to the widget in the card
Card Options
- color: - color of text in the card, eg "red" or "#ff0000"
- background: - background color of the card, eg "white" or "#ffffff"
- other: any other option is simply added to the CSS style tag of the card
Eg: {"color":"blue","background":"#f8f8f8"}
Text Info Options
- color: - color of text, eg "red" or "#ff0000"
- other: any other option is simply added to the CSS style tag of the text div
Eg: {"color":"red"}
Simple Value Options
- color: - color of text, eg "red" or "#ff0000"
- font-size: - size of text, eg "5em"
- other: any other option is simply added to the CSS style tag of the text div
Eg: {"color":"red","font-size":"3em"}
Progress Bar and Gauge Options
- max: - maximum value to calculate percentage on (if the value is not /100)
- min: - minimum value to calculate percentage on
- color: - color of the set part of the bar, eg "red" or "#ff0000"
- background: - color of the background of the bar, "#eee"
Eg: {"color":"red"}
Bar Chart and Line Chart Options
- color: - color of the line or bar
- other: any other option is passed on to Google Charts and must be valid for the Google Chart
Eg: {"color":"red"}
Widget Table Options
- total_label: string for total row label
- decimals: number of decimals to use for all values
- sprintf: format to run through sprintf() function
Eg: {"total_label":"Overall Sum","decimals":1}
Table Options
- other: any other option is passed on to Google Charts and must be valid for the Google Chart
Conditional Colouring
Most card and widget color and background options allow of conditional colouring by providing comma-separated ranges.
Eg: {"color":"red"} will show everything as red
But: {"color":"<2=red,2-10=blue,10+=red"} will show green if the value is less than 2, red if it's greater than 10, and blue if it's between.
Note that conditional colouring can only be used where it makes sense, eg progress bar, value, gauge, or bar chart.